
I was frustrated with the Houston gas station experience.
Thought I’d turn this frustration into an opportunity to build what I recommend my customers buy.
Here is what happened, and how you can build one too.
(TOOLS USED AT BOTTOM)
I built the whole stack for a gas station that does not exist. A site search across county property records. A screen for what goes on the shelf. A working model of the operation that I ran for a simulated year. 364 daily closes, about $907,000 in net, and not one of the numbers that mattered was typed in.
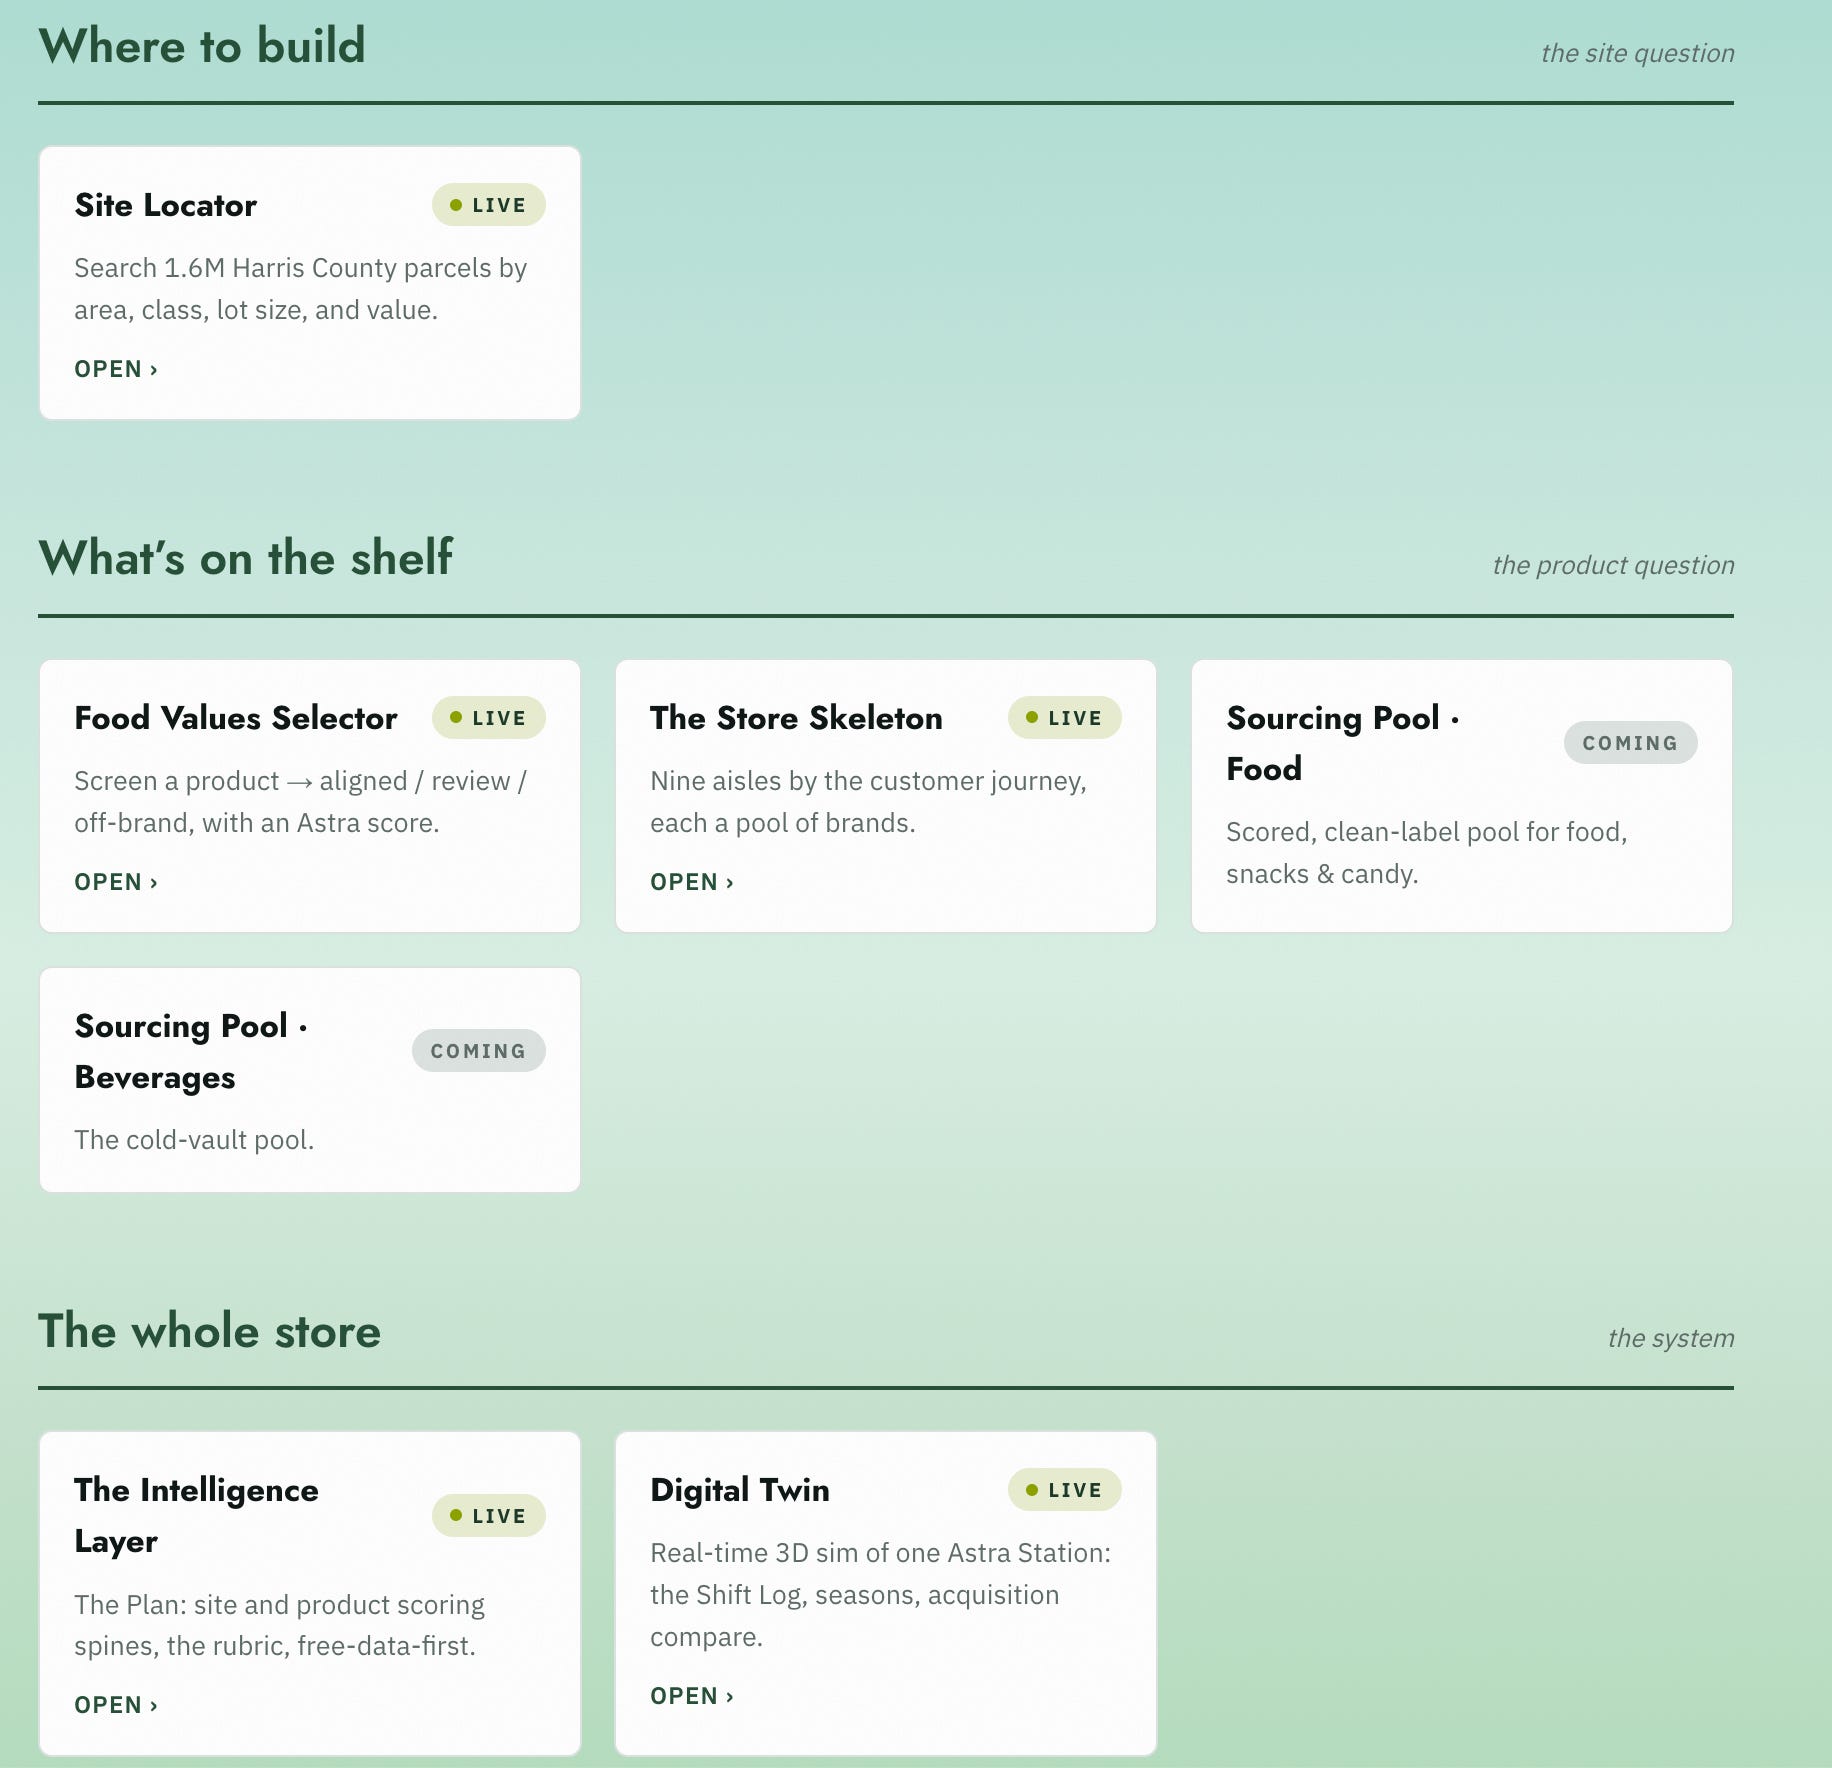
Here is what it could be: Astra - Modern Convenience “Sanctuary, not a pit stop”
I mostly wanted to see for myself what was possible. Not in a demo.
On something I cared about getting right.
The distance between what is in your head and something that actually runs is shorter than it was a year ago. That matters most for the people who already have the hard part. If you work in industrial operations you know how your plant, your terminal, your yard actually behaves, including the parts nobody ever wrote down. You can now shape that into something real yourself, far enough that when you bring the right team around you, you are handing them a working thing instead of a description of one.
The gas station was the easy case. Its numbers are public. The industry publishes its benchmarks and the county publishes the property records, so I could check my work against reality on a Saturday afternoon. Your operation publishes nothing. You have a historian, a maintenance system, a stack of spreadsheets, and people carrying the parts that were never written down. That changes the first step and none of the rest.
Step 1: Find out what is actually there.
I could have named four intersections in Houston I thought would work. That is not analysis. That is a guess with a zip code on it.
What I wanted was every commercial parcel inside a boundary I drew, with its size, its owner, its assessed value, and whether anything was already sitting on it. I did not know where that came from. I did not know that a county appraisal district publishes it, that you can download the entire thing, or that the entire thing for Harris County is about 7.4 million rows.
I had Claude walk me through it. I described what I wanted to know and asked where that information actually lives, and it took me through what the county publishes, what is in a parcel record, and what the fields mean. That was an afternoon of me asking questions I would have been embarrassed to ask a person.
Then the real work started, and none of it was the AI part.
7.4 million rows do not open in a spreadsheet. They go in a database, which for me meant Postgres, hosted on Supabase so I did not have to run anything myself. That sounds like a technical detail and it is actually the whole decision. A spreadsheet lets you look at data once. A database lets you ask it a different question every day for a year, which is what site selection actually is.
Then the names. Owner names in public records never match anything cleanly. The same company shows up four ways across four parcels, none of them spelled the way you would type it. So the search had to be fuzzy, matching close enough rather than exactly, which is a library called rapidfuzz doing the work in a few lines. Nobody warns you about this. Every real dataset has a version of it.
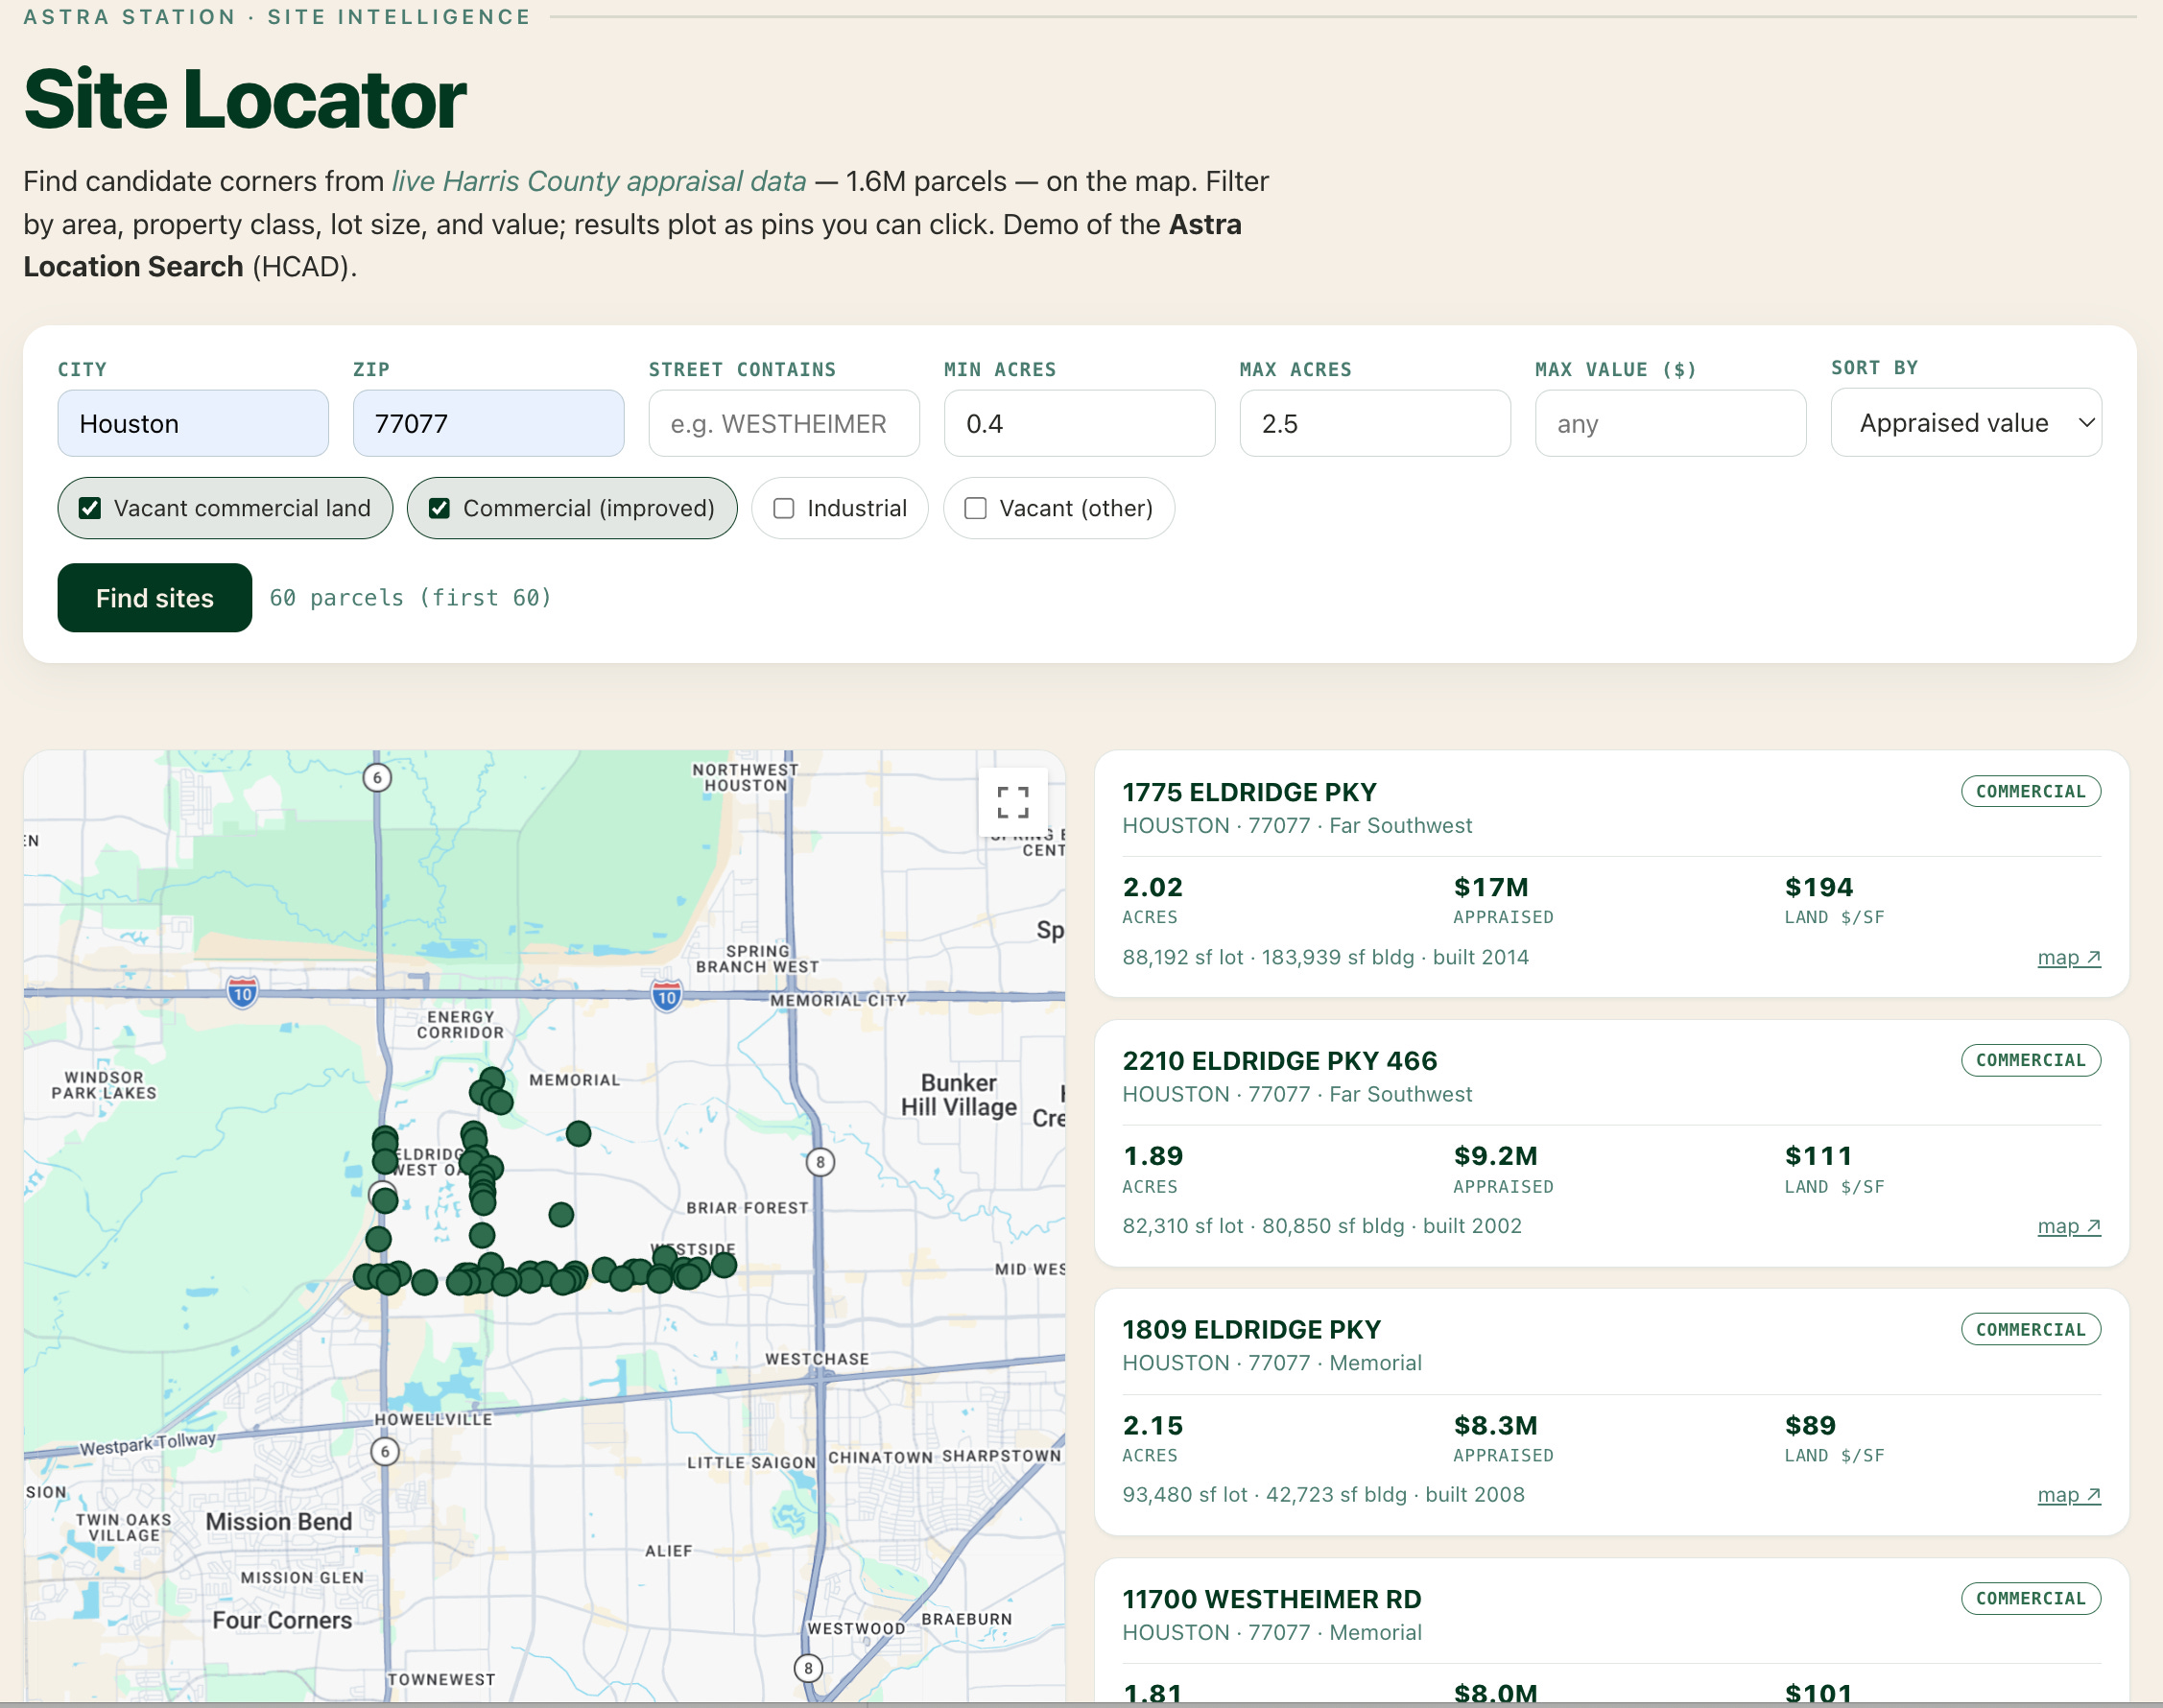
Then the map, which I assumed would be the easy part.
It was not one decision. I went through several open source mapping options before I had something that put my parcels where they belonged and stayed readable at the zoom I cared about, and I ended up on Google Maps. Every attempt taught me something about what I actually needed, which I could not have written down at the start, because I had never seen my own data on a map before.
Then a problem I did not see coming. I would find something good and then lose it. A search that took twenty minutes to get right lasted until I closed the window. So the next stretch of work was saving. Keeping the parcels I flagged and the searches that worked, so the second session started where the first one ended.
And then the part that turned out to be the actual build. Having 7.4 million records and a map does not narrow anything down. I had to work out what needed to be in front of me at the moment I was making a judgment. Which fields, in what order, next to what. Most of what I built after the data was loaded was not analysis at all. It was getting the right five things on the screen so I could look at a parcel and say no in four seconds.

Here is what to take with you. The intelligence was the last thing I added and the smallest part of the work. Getting the record somewhere it could be questioned was most of it. Deciding what to put in front of a human at the moment of judgment was the rest. And anything you work out that you will want again goes into the tool, not into the conversation.
Your version of this is not a county appraisal district. It is your own asset register, your equipment history, your inspection records, the plant files, sitting in three systems that do not talk and a shared drive nobody has cleaned since 2019. The step is identical. Get it into one place that can be asked a question. Fix the way things are named. Then work out the five fields a person needs on screen to make the call, because that is the part that decides whether anyone uses it.
Step 2: Write the rule down before you ask the model anything.
A convenience store lives or dies on what is on the shelf, so the second build was a screen. Hand it a product, get back whether that product belongs.
The first thing I got wrong was assuming this was a question I could ask. You cannot ask a model what belongs in your store. It does not know what you care about, and if you do not tell it, it will hand you something reasonable and generic, which is worse than nothing because it looks like an answer.
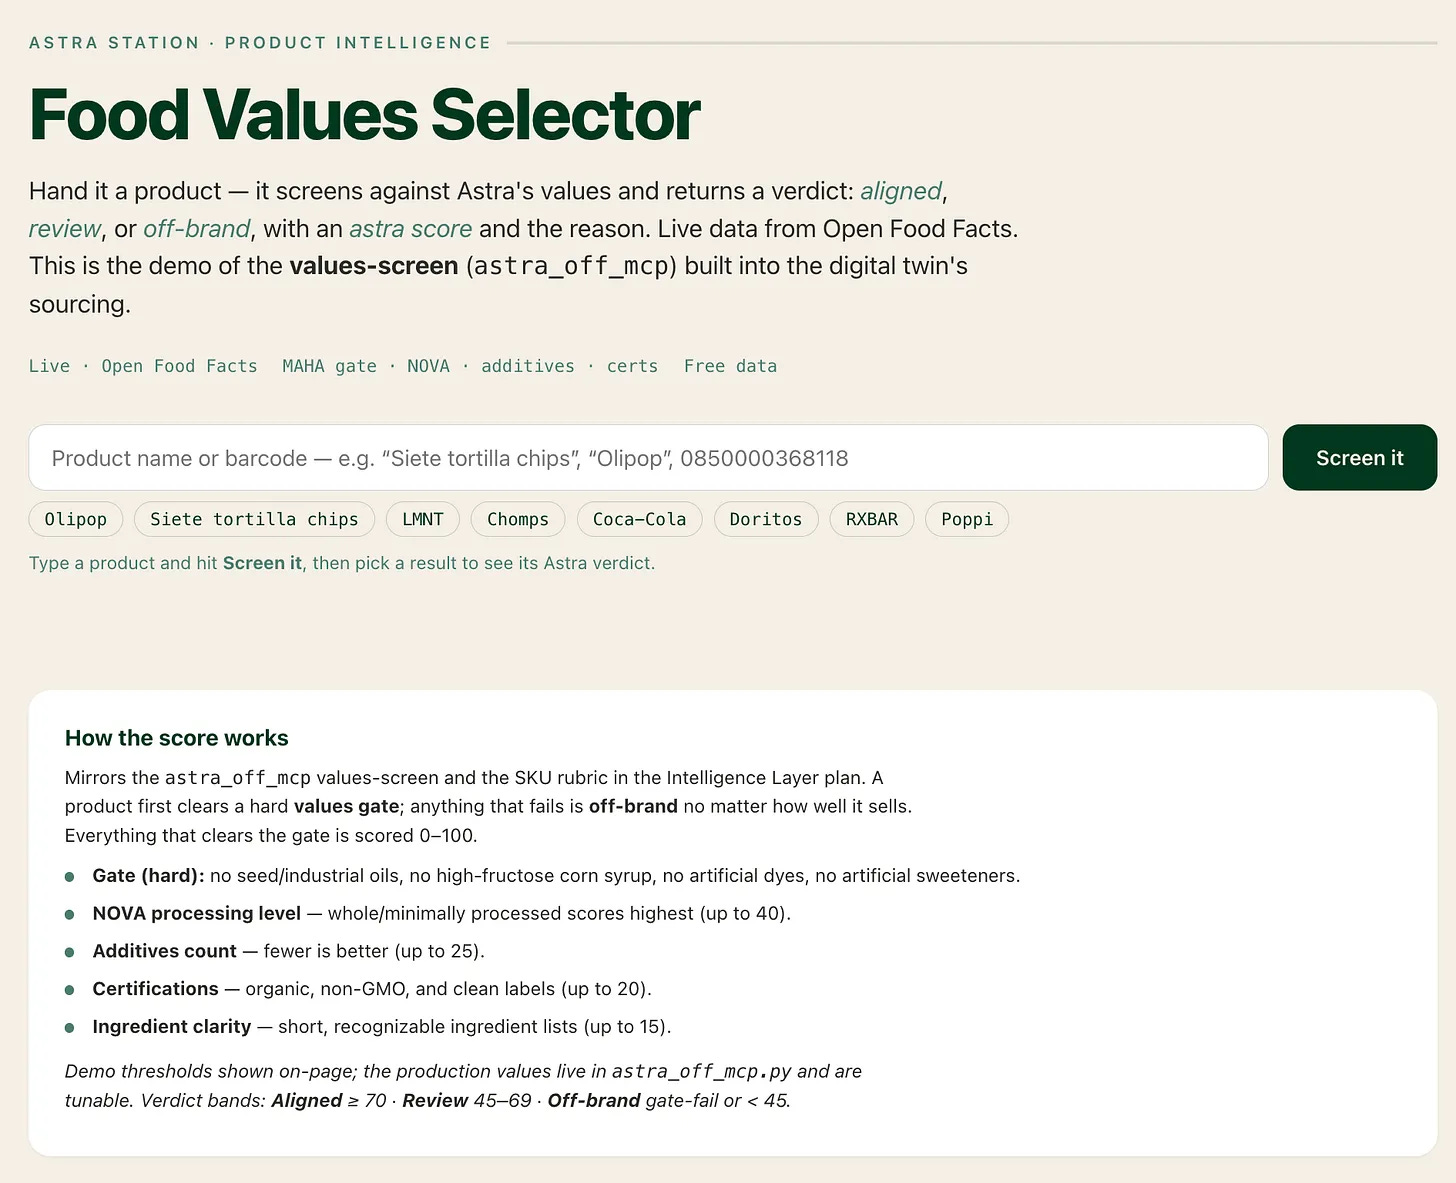
So I had to write the standard down. Mine screens on how heavily processed a food is, what additives it carries, and what it is certified as. Those are my criteria. Yours would be different, and that is not the point. The point is that the standard existed, in writing, before the model touched a single product.
I wrote that value system myself. Claude wrote the prompt that applies it. That division is worth saying out loud, because it is the honest picture of how this work goes and it is the part that should encourage you. I am not a developer and I did not need to become one. What I could not hand to anybody was deciding what good means. What I did not have to work out alone was how to turn that decision into something a model applies the same way every time.
That is the part I would tell any engineer twice. Every argument I have watched about whether an AI answer is right turns out, underneath, to be an argument about a definition nobody wrote down.
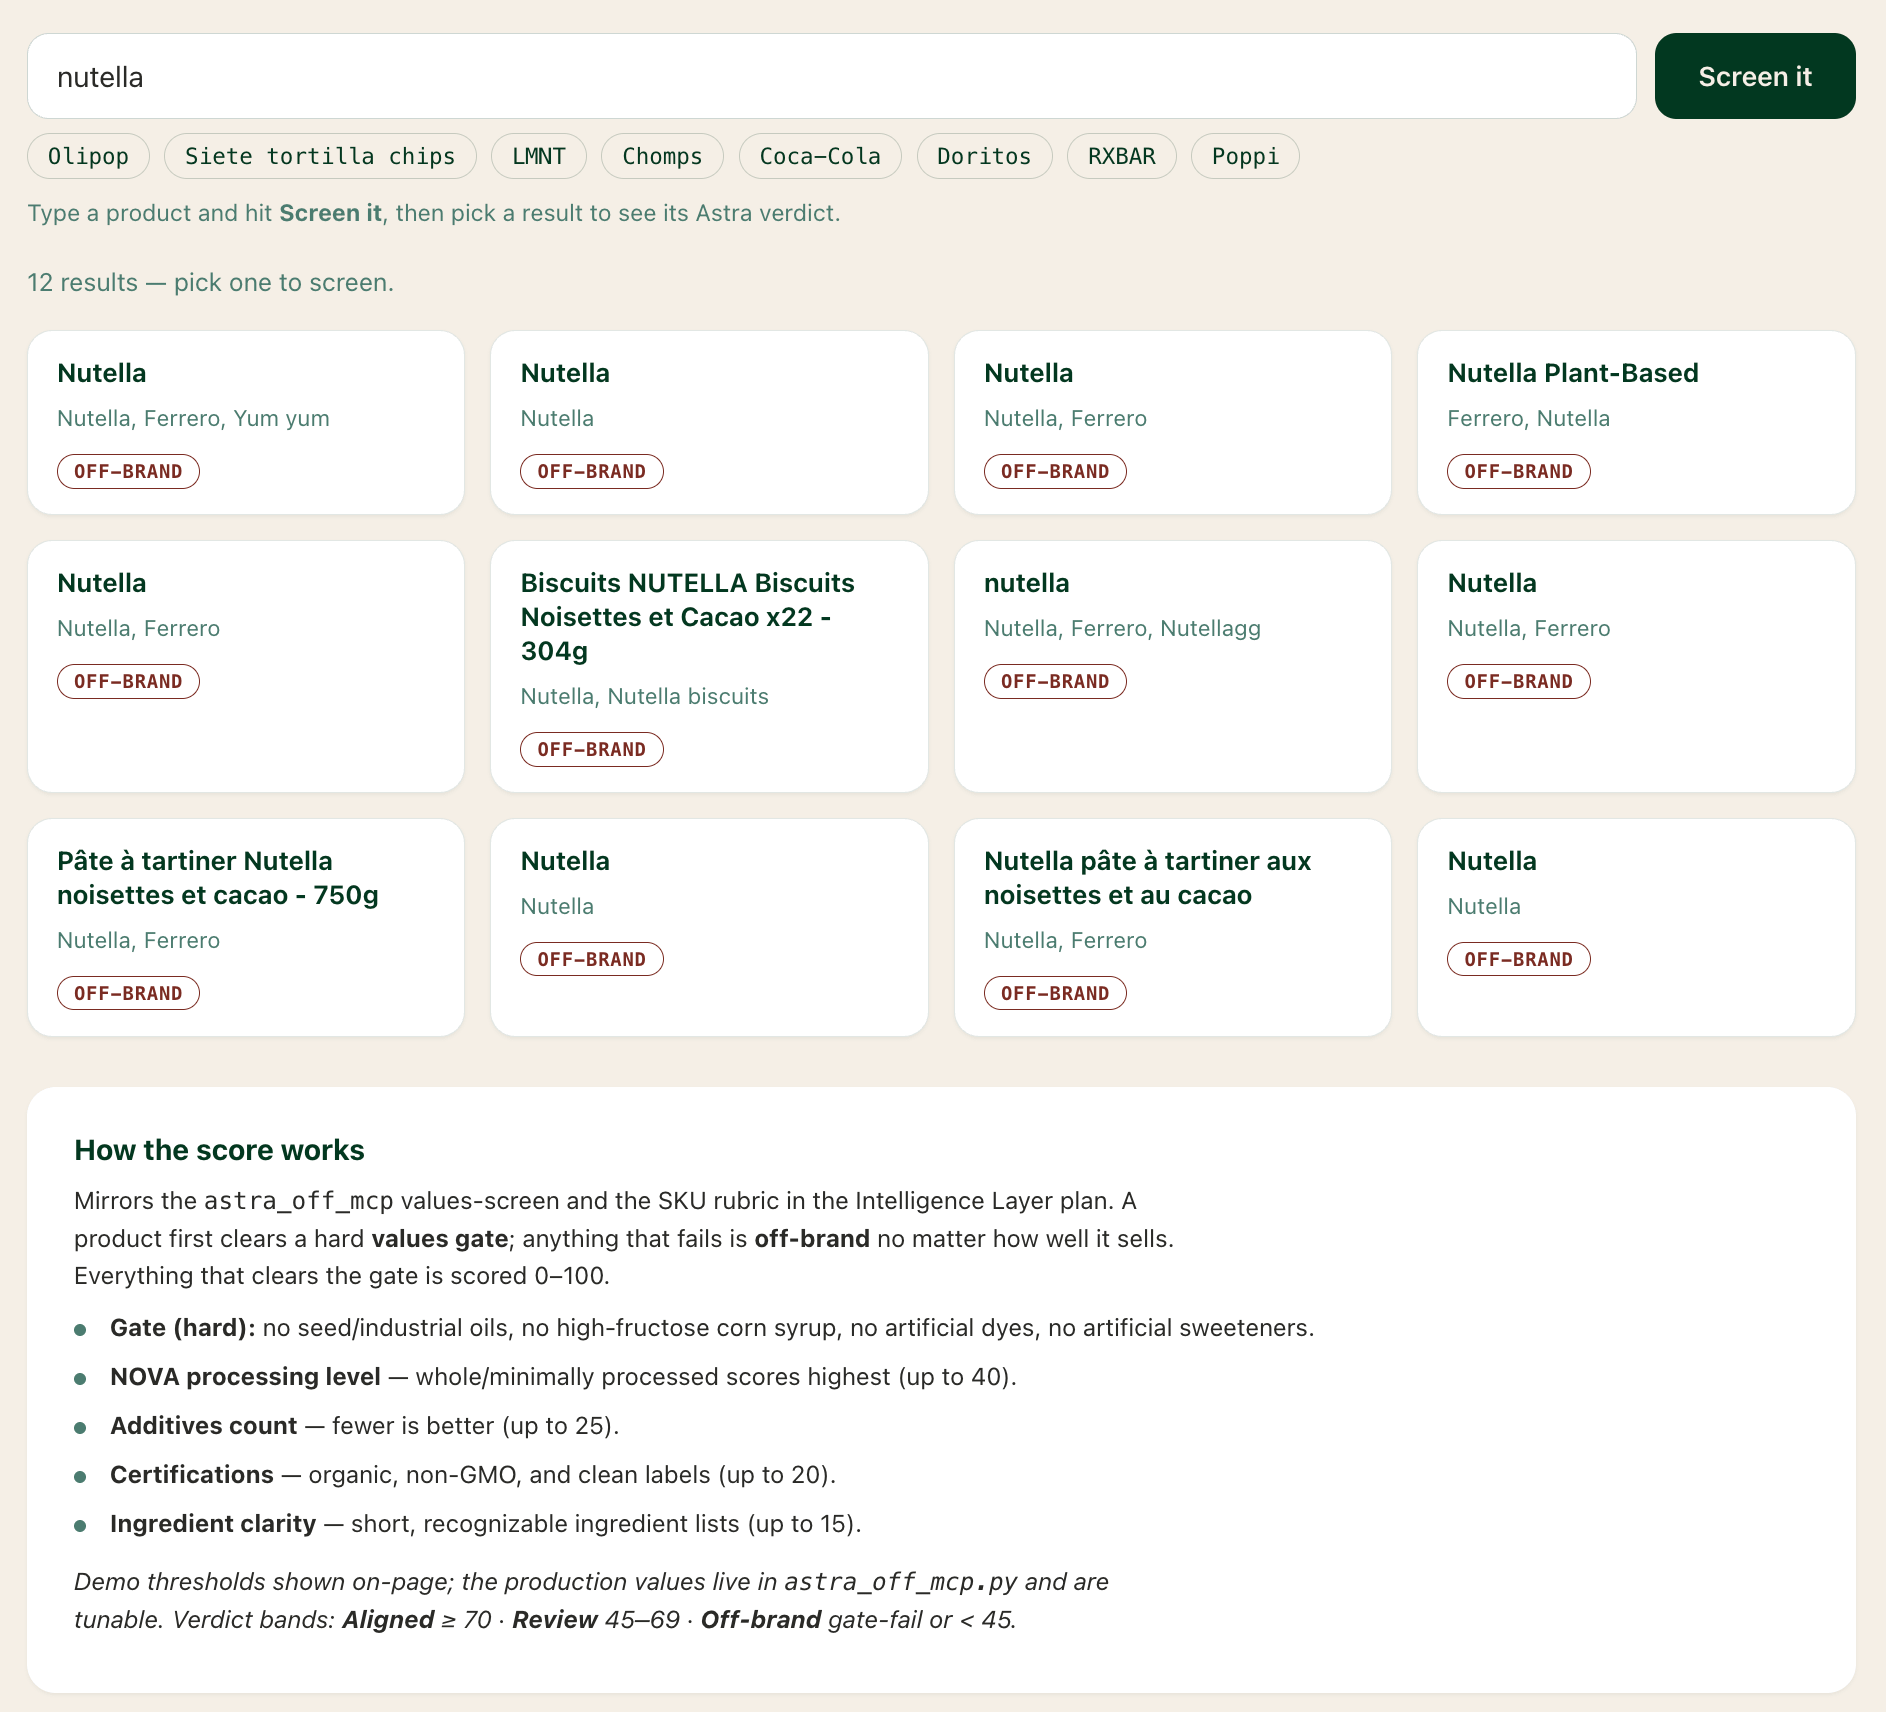
Then the screen needed something real to look at. I used Open Food Facts, an open database of packaged products that costs nothing to query. And instead of pasting product details into a chat window, I built a tool that Claude can call directly. Python, using FastMCP, which is a way of handing a model a tool and telling it what the tool does. Give it a product, it goes and looks up the real record, applies my written rules, and comes back with a verdict.
The verdict has three buckets. Aligned, review, off-brand. The middle one is the one that matters. A screen that only says yes or no will force a bad call on every product that does not cleanly fit, and in a real catalog that is a lot of them. Review means the tool is telling me it is not sure and a person should look. I would rather have that than a confident answer I cannot check.

The second half of this build is the one I am proudest of and it does not work yet.
To know whether any of this pencils out, I need real wholesale cost, and real wholesale cost lives behind a distributor account I do not have. So the connector is built, wired, and waiting on an API key. Until it gets one, it returns nothing. It does not estimate. It does not reason its way to a plausible number from what it knows about the industry.
That was a deliberate decision and it is the single most important line of this whole piece. A tool that returns nothing is honest. A tool that returns a plausible number you cannot trace is a liability, and it is worse in industrial work than almost anywhere, because the number does not stay on the screen. It ends up in a capital request.
One more thing about this build, because it is the piece that points forward.
Those same two tools are most of an ordering loop. Somebody checks out and the register drops the count. A level crosses a threshold. Something checks the approved list, checks the cost, places the order with the distributor, and the delivery lands on a schedule the model already knows about.
None of that chain is exotic, and two pieces of it are already built. What is missing is a distributor account, which is a business step rather than a technical one.
I would run the first long stretch of that with a person approving each order. Not because the machine could not do it. Because in industrial work an automatic order is a purchase order with somebody’s name on it, and taking the name off is the fastest way to lose the room.
Your version of this is anything you buy against a spec. Valves, lubricants, coatings, chemicals, spare parts, contractor scopes. Same three steps. Write down what qualified actually means, in a document, before anyone builds anything. Point the tool at the real source of record rather than at the model’s memory. Give it a way to say I am not sure, and a hard wall where it returns nothing instead of inventing a number.
An aside, for the procurement side of your operation.
You already have this document. It is called the approved manufacturer list. It is a PDF, it was last revised a few years ago, and it lives in a folder nobody opens at the moment somebody actually places an order.
It is the same object as my food standard with attributes in place of ingredients. Size, type, material, brand, pressure class, whatever your list actually turns on. Move it into the context layer where the model doing the work can see it, and the check happens at the moment of the decision instead of three weeks later on an invoice.
That is not an AI project. That is a document you already own, put somewhere it can be read by the thing making the call.
Step 3: Build the operation, one runnable piece at a time.
This is the one that changed how I think.
I found the idea on Twitter. Somebody had built a kingdom simulator that ran in a single web page, with a written chronicle of everything happening in it. Not a dashboard. A world that ran, and told you what it was doing in plain sentences. I looked at it and thought, that is a convenience store.
I had never used Three.js, which is the library that draws 3-D in a browser. I did not know what a deterministic seed was or why anyone would want one. I asked, and what came back was the single most valuable idea in the whole project, so I will give it to you before the phases. If your model uses randomness, fix the random seed so the same run produces the exact same result every time. Otherwise you change something, the numbers move, and you have no idea whether your change did that or the dice did.
Everything below runs in one HTML file. No install, no server, no account. It opens in a browser.
Phase 1: The Lot
The first version had no people, no money, and no store. Cars arrived off the arterial in the platoons a traffic signal actually creates, pulled in, fueled, parked, and left.
That was on purpose. I wanted the smallest thing that visibly ran, because a model you cannot watch is a model you cannot debug.
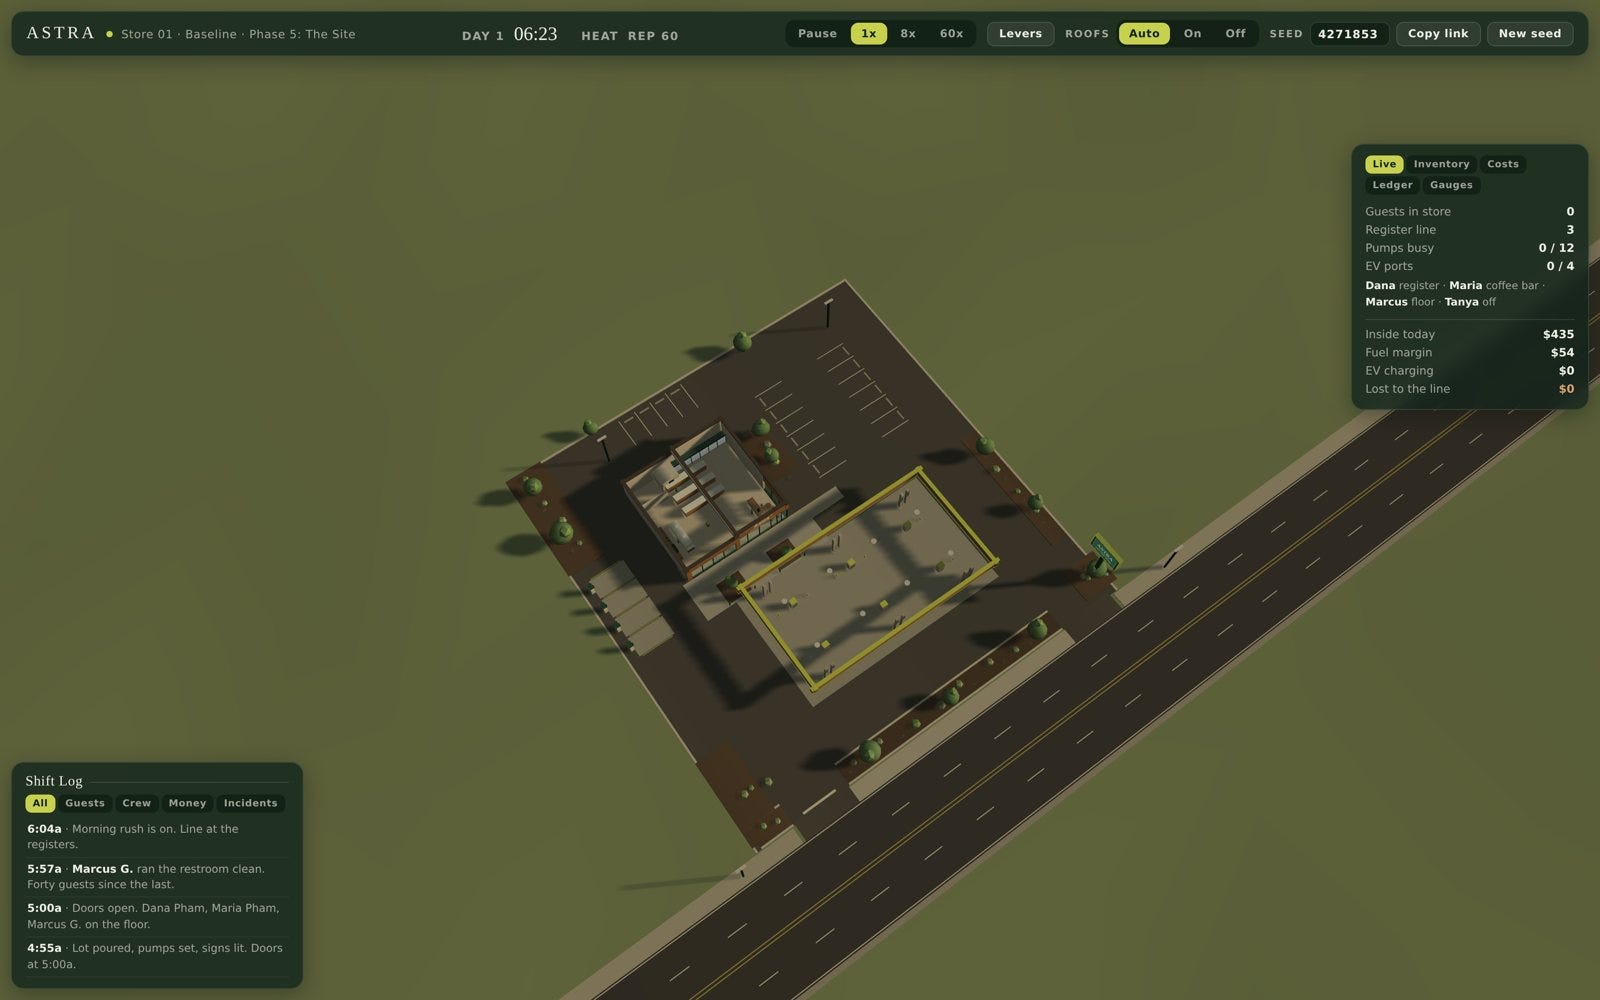
Two bugs from this phase are worth your time because both are the same shape. Cars would arrive at a pump and freeze there forever, and the lot would slowly clog until nothing moved. The braking curve was stopping cars just outside the window where the fueling behavior triggered. They were parked half an inch from being noticed. Separately, cars that failed to spawn were still consuming their slot in the queue, so traffic thinned to a trickle for no visible reason.
Neither was a modeling error. Both were the kind of thing where the simulation looks plausible and is quietly wrong. That is the real risk in this whole exercise, and it is why the next phases all end in an audit.
Phase 2: The People
Then crew, customers, and a register. Guests walk from their car, pick up different things depending on the time of day, queue, and some of them look at the line and leave without buying anything. Three named crew members work task loops. Eight named regulars come in on schedule.
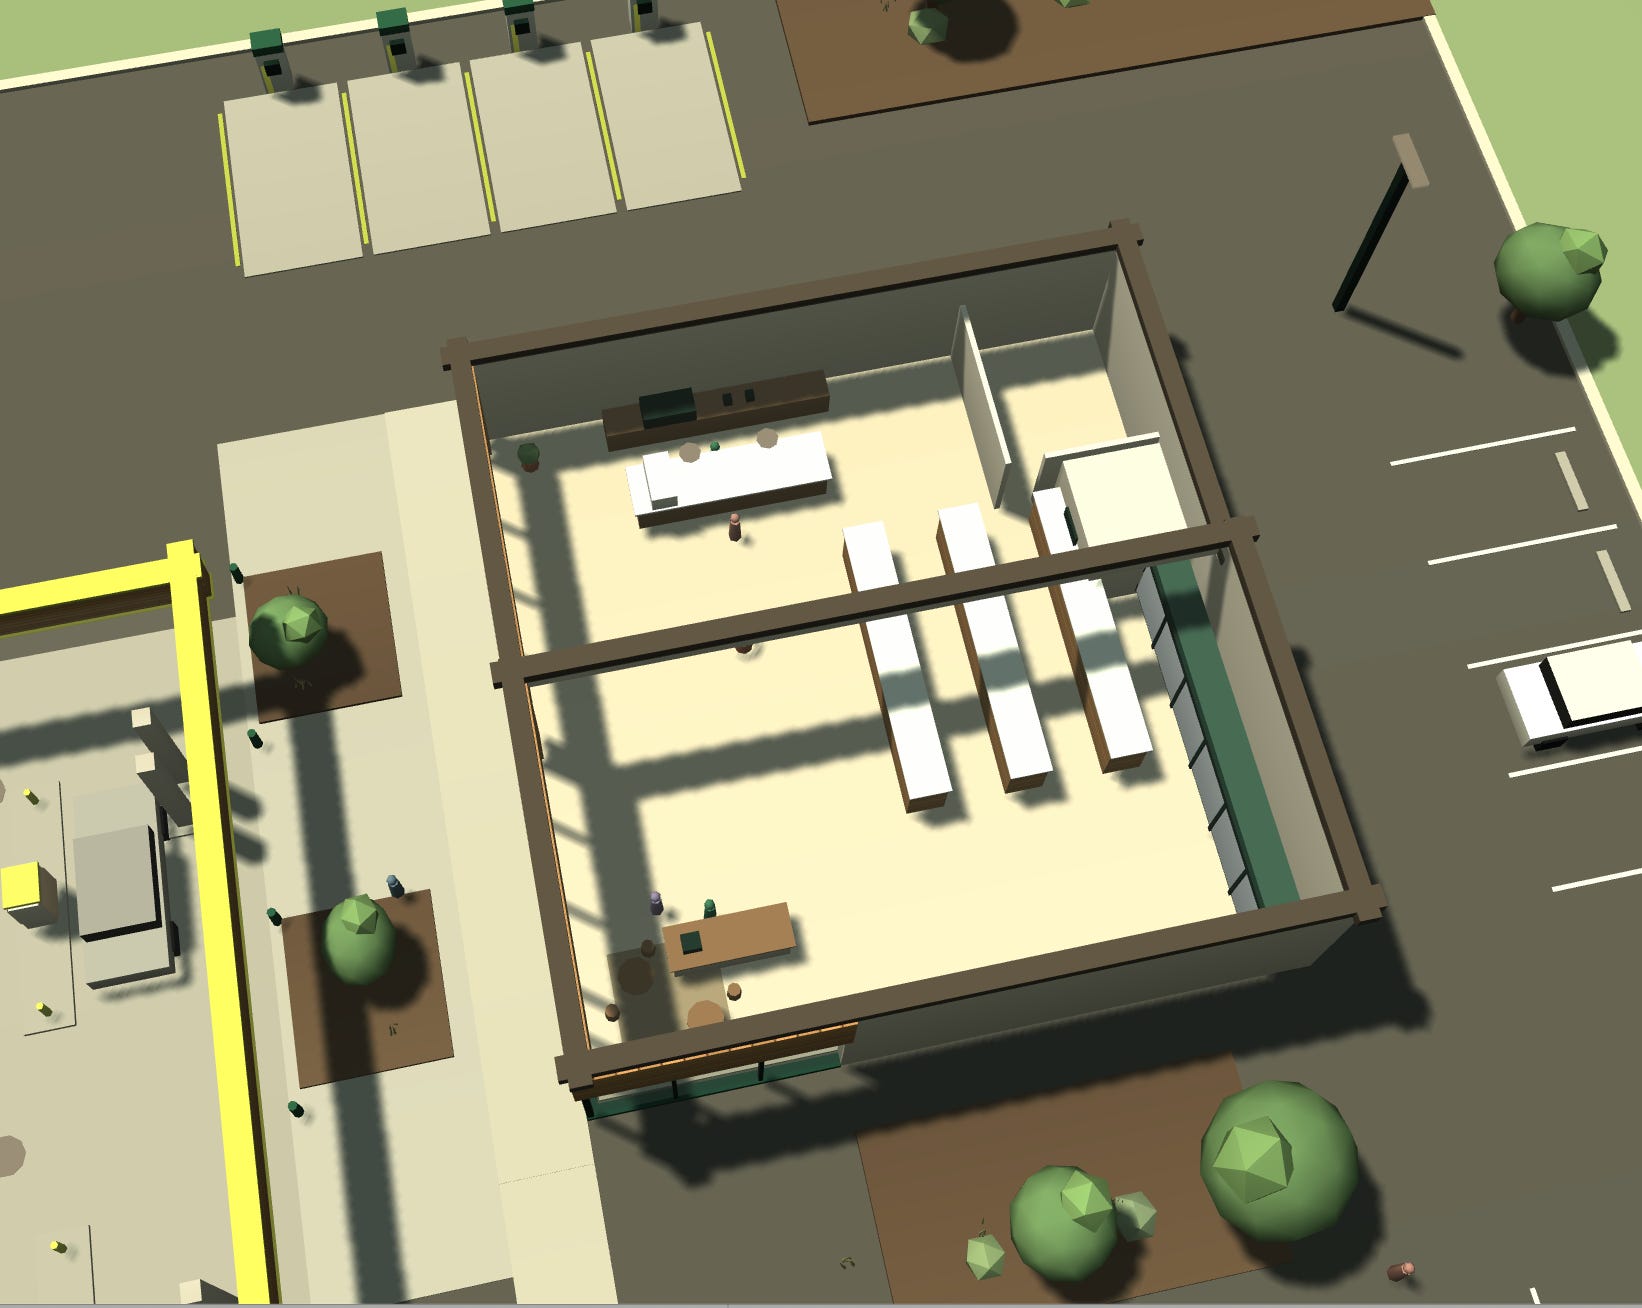
The regulars are not decoration. Once the log said “Earl Delgado in at 7:13, large coffee and two kolaches,” I started noticing things I would never have found in a table.
The lesson from this phase is the one I would put on the wall. I first wired the staffing decisions to the queue I could see on screen, which is what any normal person would do. It was wrong. The visible queue is a small sample of what is actually happening, so the store would open a second register based on a handful of visible people while the real transaction count said something else. I moved every trigger onto the books, the underlying ledger of what the store is actually doing, and left the visuals as visuals.
If you build one of these, expect that. What you can see is not the data. It is a dramatization of the data.
Phase 3: The Books
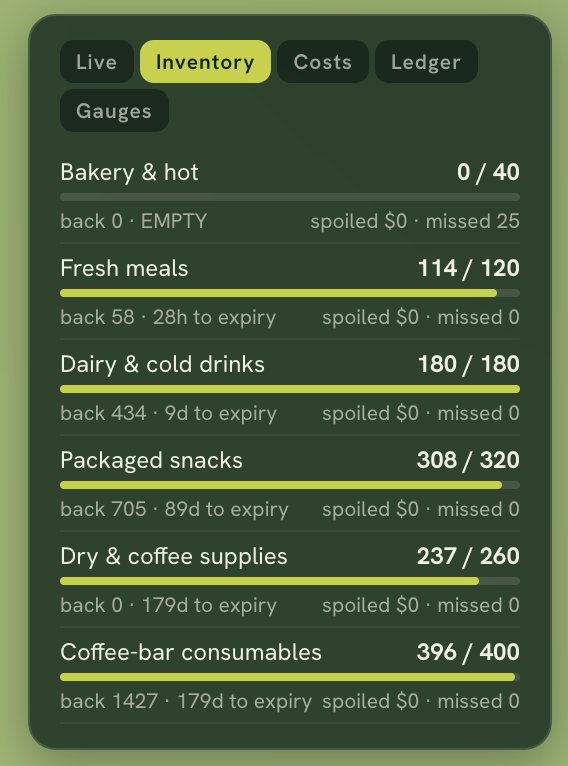
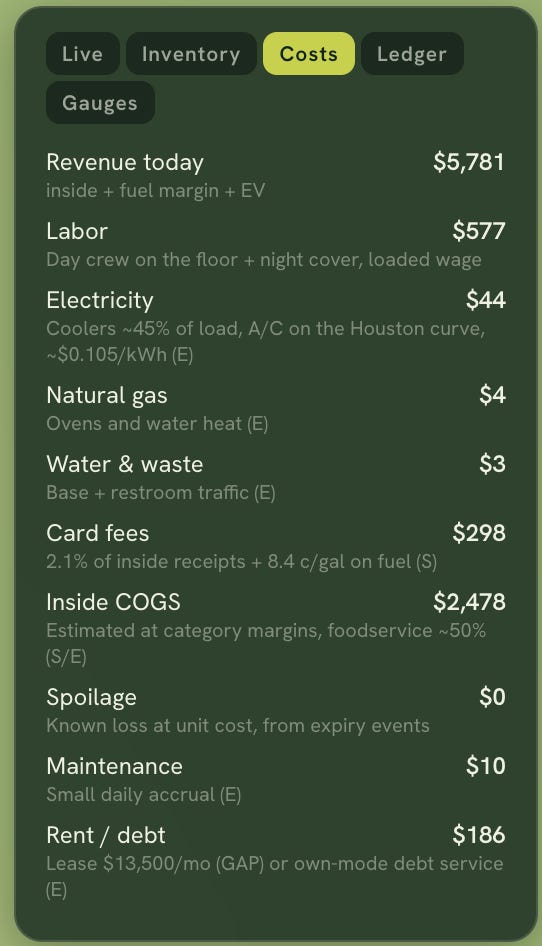
Six inventory categories with batches that age. Deliveries on a truck schedule. A full cost stack: labor built up from actual crew hours, power built up from kilowatt hours, card fees charged when the transaction posts, tax accrued.
Here is the rule I held to, and it is the reason any of this was worth doing. Spoilage is not an input. Labor percentage is not an input. Nobody types those in. They fall out of the run. Over a four week baseline, spoilage came out between $98 and $116 a day, because product aged on a shelf and did not sell in time.
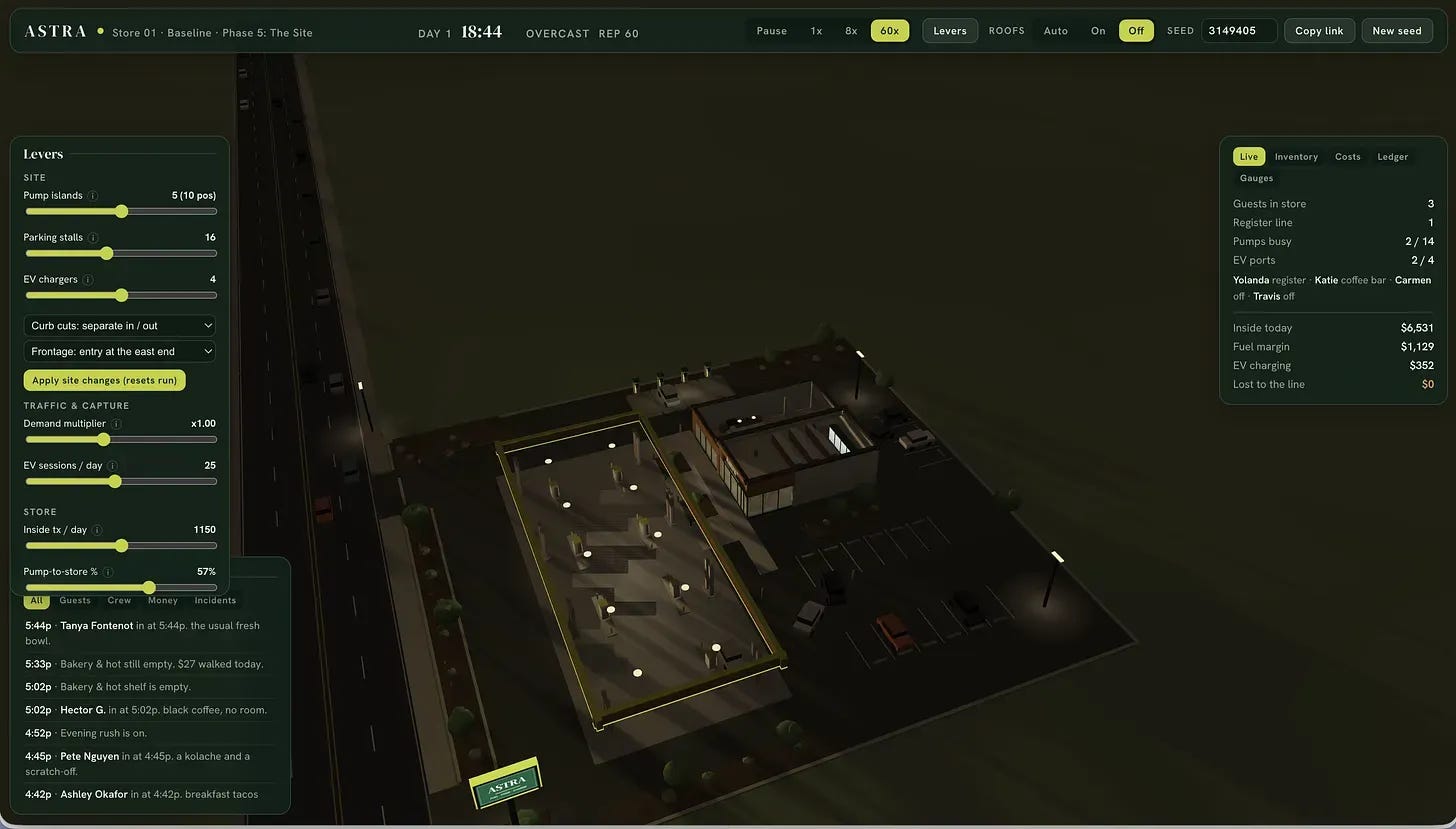
Every input that does go in carries a confidence tag, so I can see at a glance which numbers are verified, which are sourced, and which are my guess. That matters more for you than it did for me, and I will come back to it.
Every simulated day ends with an audit that checks the books balance. Twenty eight days, twenty eight audits. When I pushed the store to two crew, the model showed about $720 a day walking out the door because of the line, with the log narrating the waits.
The bug from this phase: I originally posted deliveries when the truck visually arrived. Run the simulation faster and the truck arrives at a different point, so inventory changed depending on playback speed. Deliveries now post to the books on schedule and the truck is theater. Anything that touches the money has to live on the clock, not on the animation.
Phase 4: The Year and The Comparison
A full 52 weeks. Houston seasons with real dates, temperature driving the power bill, school and travel patterns, daily weather, a hurricane week. Then the thing I actually built all of it for.
Take one site. Run it as it exists today. Run it again with the changes I would make. Same seed, same weather, same customers, one difference. Over four weeks, as-is came out at $30,616 and the changed version at $58,618.
That number is not a forecast and I would not defend it as one. What it is, is a disciplined way to argue about a decision. Everything in both runs is identical except the thing under debate, which is almost never true when two people argue about a capital project with two spreadsheets.
The 52 week run closed 364 days out of 364 with clean audits and about $907,000 in net, with the summer power spike and the
hurricane week visible in the ledger.
This phase also produced my favorite failure. At one and a half times normal demand, the lot deadlocked. 147 cars, nothing moving, a queue backed up behind the store. In the real world drivers do three things I had not modeled. They get impatient and take smaller gaps, they see a full lot and drive past, and they give up on the pump and park instead. Adding those behaviors fixed it, and the deadlock check is now part of the daily audit.
I would have found that in the model or I would have found it in concrete.
Phase 5: The Layout
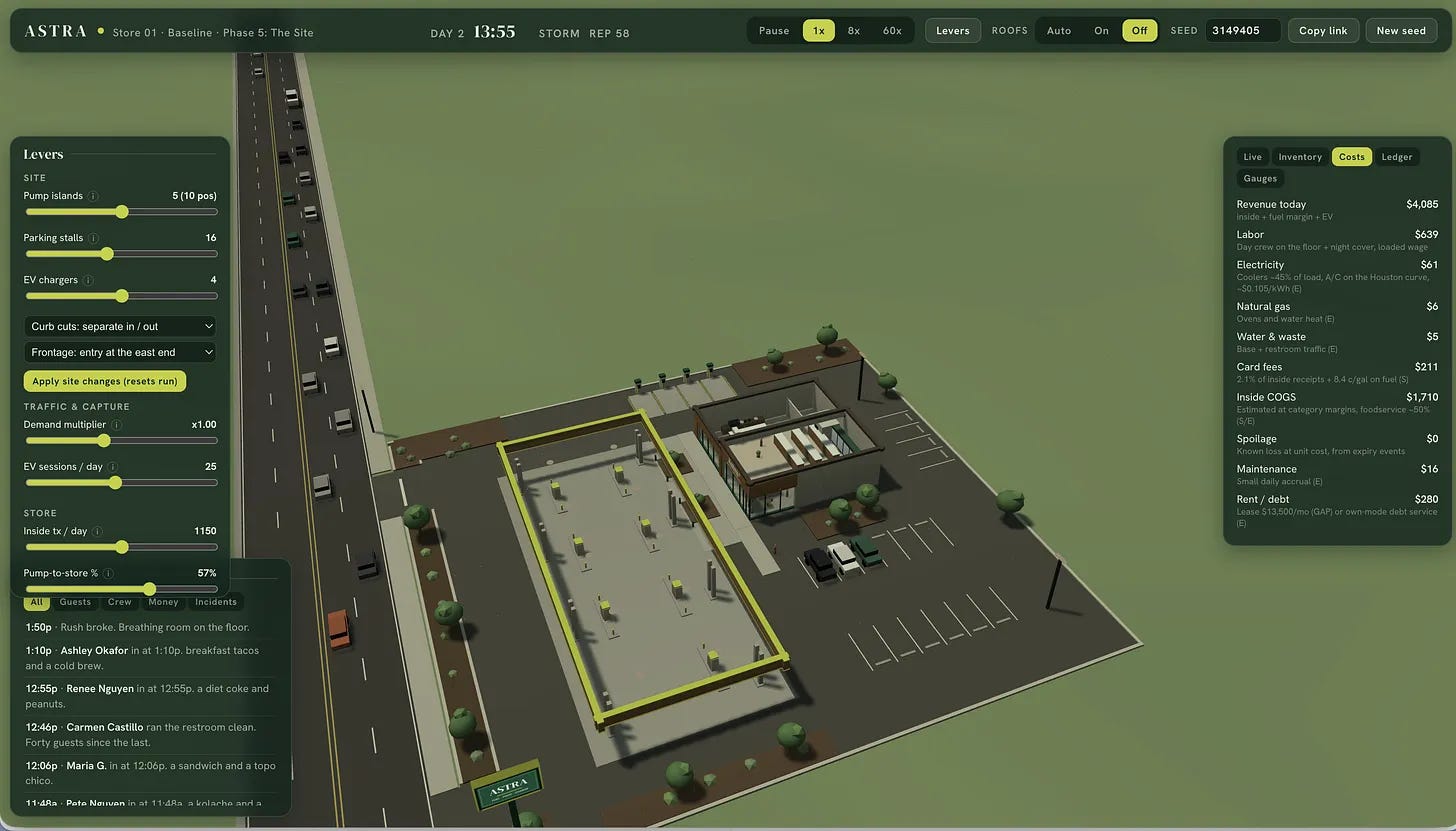
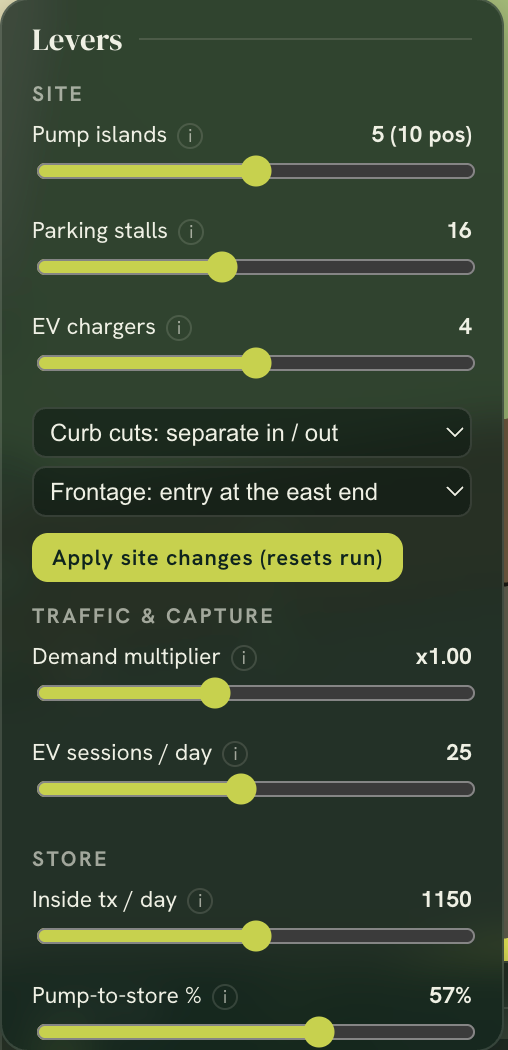
Last, I made the physical site a set of parameters. Number of pump islands. Number of parking stalls. Chargers or none. One curb cut or two. Change them and the lot re-plumbs itself and the traffic finds new paths.
The undersized configuration made about $39,500 a week inside the store against $51,800 for the default. The site was strangling the business, and you could watch it happen.
That is the one thing in this whole build a spreadsheet cannot do for you. Geometry is the constraint you cannot revisit after the concrete is poured.
What the levers are actually for
Every assumption in the model is a lever I can move, and moving one is how the thing earns its keep.
Change the product mix and watch it land on spoilage and on margin at the same time, in opposite directions. Change when the trucks come and see whether the shelf holds through the gap. Change the crew count by daypart and read what the line costs in dollars walking out the door. Move the wage and see whether the better crew pays for itself.
That is a buying decision, a scheduling decision, and a staffing decision, tested before any of them cost anything. It takes a year of operating to learn those the ordinary way, and the ordinary way charges you for every lesson.
And once the model exists, it is not one store. The site geometry is a parameter. So is the traffic, the product mix, the wages, the lease, the power rate. Drop in the details of a different location and it runs that location. The first store is the build. Every store after it is an afternoon of data entry.
An aside, for anyone running capital projects.
A capital project is the same object. A set of assumptions, a layout you cannot revisit once it is built, a schedule, and a number at the bottom that two people are arguing about with two different spreadsheets.
Build the thing that runs instead. Put the assumptions in with confidence tags so everyone can see which numbers are verified and which are somebody’s estimate. Then change one variable at a time and watch the bottom number move. The argument stops being about whose spreadsheet is right and turns into which assumption is wrong, which is a much shorter argument and a much better one.
The layout point matters most here. Geometry is the constraint you cannot revisit after the concrete is poured, and it is the thing almost nobody models before they pour it.
Step 4: The Garage
The store needed to look like something. Not for customers. There are no customers. For me, and for anyone I would eventually put it in front of.
So I built the storefront, and the first version was wrong.
Not broken. Wrong. It aimed at a feeling that had nothing to do with what I actually wanted the place to be, and I could not tell that from the idea in my head. I could only tell once it existed and I was looking at it. So I threw it out and rebuilt it, and the rebuild took a fraction of the time, because by then I knew what I was looking at.

It did not stop at a website. The concept needed a world, so I built one.
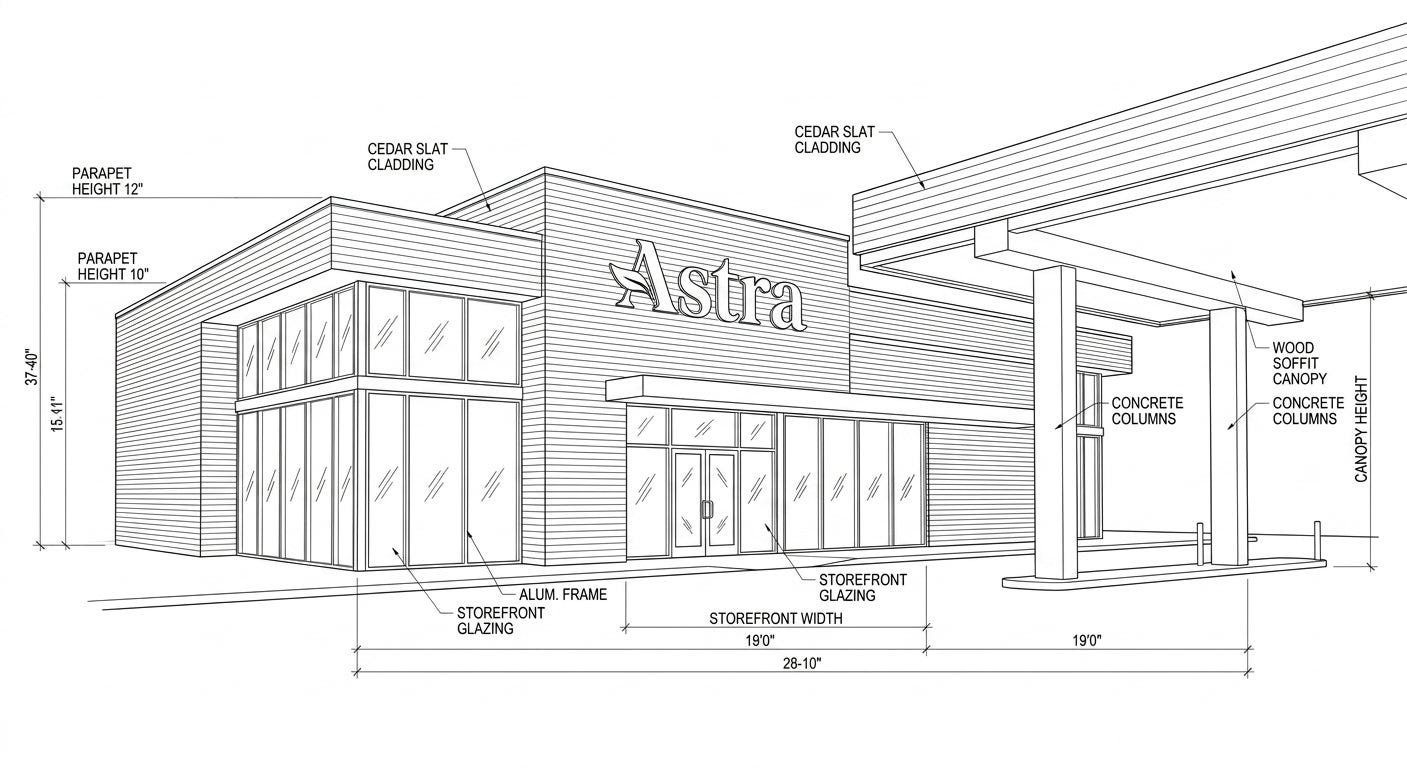
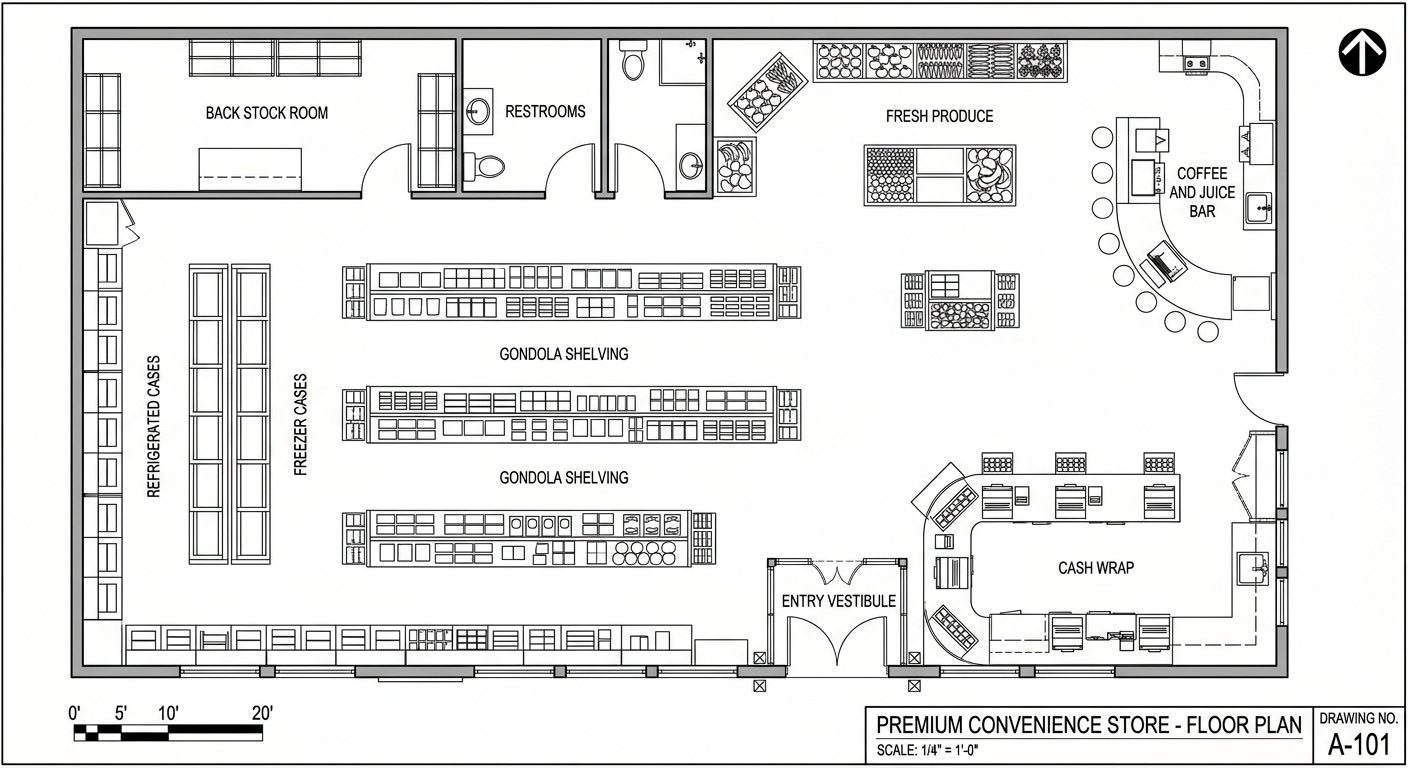
The site in isometric at dusk and in daylight. An aerial of the parcel. The interior. A night hero. The store as it exists today, before any changes, sitting next to the version after them. Five characters, because a store is people and not a building: a lead, a cashier, a barista, a wellness associate, an attendant working the fuel and the EV canopy. Then scenes with those characters in the space, at the register and at the coffee bar. Marketing aerials of Houston at dusk and at rush hour. Trade area discs at two kilometers and at ten. A pole sign. A brand sheet holding all of it together.
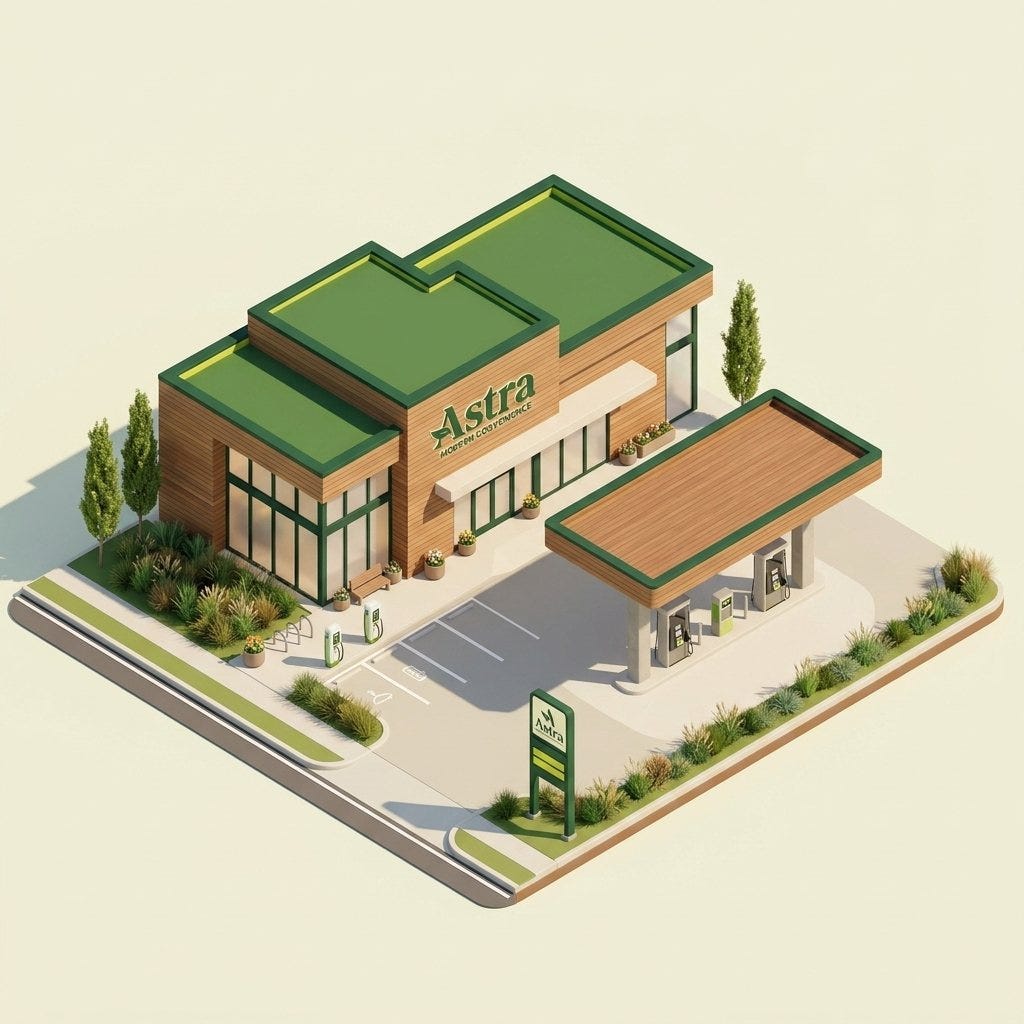
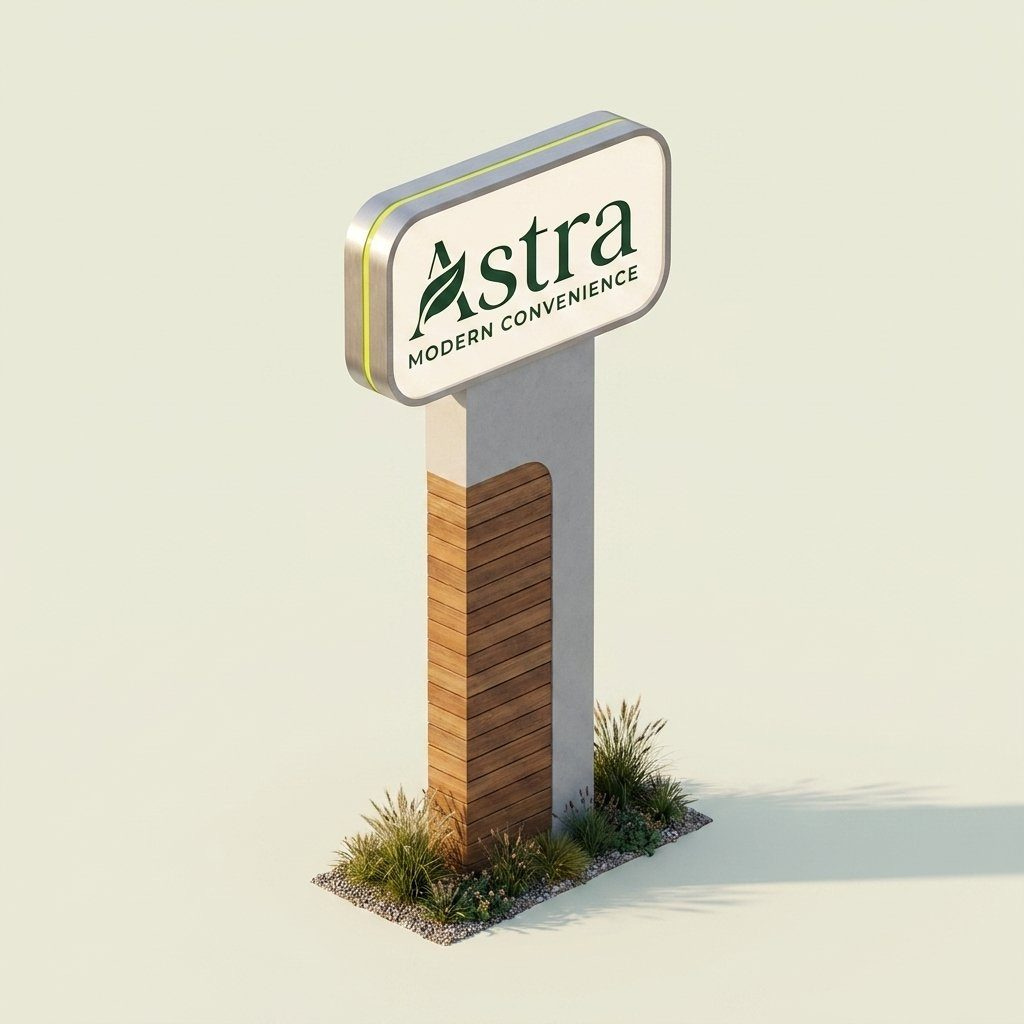

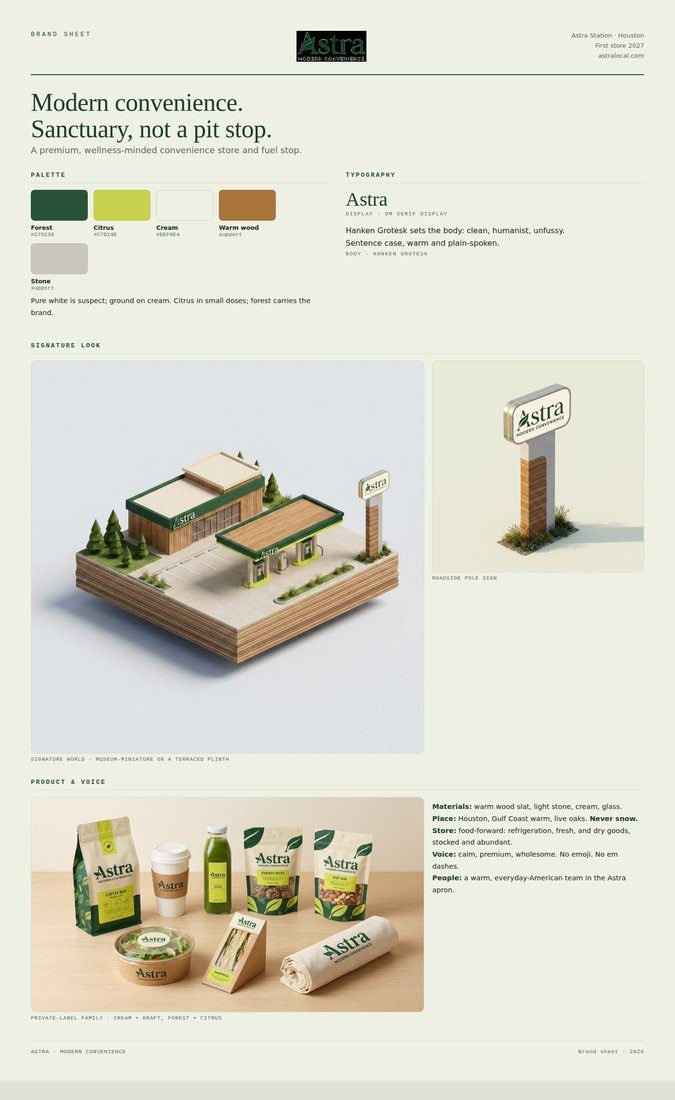
The archive folder is the honest record of how that went. There is a winter version of the world in there, retired, and the filename says why: no snow in Houston. There is a pole sign that was rectangular before I understood what I was looking at, and a second one that was too tall. There is an interior that came out sparse and empty. None of those were planned as drafts. Each one was going to be the final version right up until I looked at it.
That is the part I want to hand to the engineers reading this, and I mean the mechanical, civil, chemical and industrial engineers specifically.
Every one of you has software in your head. Better software than what you have been issued. You know exactly what the tool should do, because you have worked around the one you have for eleven years. Some of you have already written a piece of it. A Python script that pulls the report and cleans it up, running on your machine, that four people at the plant quietly depend on and nobody in IT knows exists.
That is where it always stopped. The distance between a script that works for you and something you can hand to another person was enormous, and the queue for real development time was measured in quarters, and by the time your idea reached the front of that queue it had been rewritten by somebody who had never stood on the unit.
That distance is a lot shorter now. You can build the thing. Not a description of it, not a slide about it. A working version, this month, that other people can open and react to.
And when they react, you find out fast which parts of your idea were right. My first storefront was wrong in a way no amount of thinking would have shown me. Six days of building told me in an afternoon of looking.
None of this makes you a software company, and I would not pretend otherwise. A prototype is not a system. It has no security, no support, no one on call at two in the morning. What it does is turn the thing in your head into something real enough to be argued with, which is the only way it ever gets built properly by the people who build things properly.
What it caught, and what it still cannot do
Two numbers I had written down before I built anything turned out to be wrong, and the model is how I found out.
I had assumed that about 38 percent of the people who buy fuel come inside. The published range for the industry is 57 to 67 percent. I was not a little off. I was off by enough that everything downstream of it in my thinking was wrong, and I had been reasoning confidently from that number for weeks.
I had property tax at a figure that turned out to be three to four times too low. That one is worse than it sounds, because it is fixed and monthly. Get it wrong and every scenario you run is optimistic in a way you will not notice until you are living in it.
Neither of those was caught by intelligence. They were caught because building the model forced me to write the number down somewhere it could be compared against a published one. Most of the value of this exercise is that plain.
Now the limits, flat.
The model is not the store. It is a set of arguments about a store, arranged so they run. Where the inputs are verified it is worth trusting. Where they are my estimate it is worth exactly what my estimate is worth, which is why every one of them carries a tag saying which it is. If you build one of these and skip the tags, you will end up with a machine that turns your own guesses into confident output and hands them back to you looking like findings.
The wholesale cost is still not real. It is waiting on an account. Everything I believe about the actual margin is inference until that connects.
And the whole thing runs on behaviors I decided were true. Customers give up on a line at the point I said they give up. That number came from somewhere reasonable. It is still mine.
Where this goes
I am going to keep building things like this.
Not because I am going into the convenience store business. Because it is the best way I have found to help the people I work with build out their own vision. You cannot advise somebody well on a thing you have never made. Every hour I spend building something I do not need teaches me something I can hand to somebody who does.
So there will be more of these, and they will not all be gas stations. Books for my daughter are next! Notre Dame books! (Go Irish!).

Where to start
Start with a website. Your own. Nobody is watching it and nothing breaks if it comes out ugly, which makes it the cheapest place in the world to find out what these tools actually do.
Then build something for your family. An app only the five of you will ever open.
Then replicate your house. Put it in 3-D and make it run, the same way I did with a store, on a building you already know better than anybody.
Then write your kid a book. More on that one next month ;).
The pattern under all of it is the same. Start with what is already in your head. Tell Claude or Codex plainly that you are not technical and that you want to be walked through every step no matter how small. Then go. I asked questions I would have been embarrassed to ask a person, and every one of them got answered the same way.
And when you do not know what you want it to look like, go to Twitter. Find a few designs you like, feed them in, and say I like this style. That is a legitimate way to start. It is what I did.
You will not end up with a system. You will end up with a working thing instead of a description of one, and a much better vision for what could be vs what exists.
- Marty Dytrych
Tools Used
AI and agents
Claude, as the thing I actually built with, through Claude Code
Anthropic Python SDK (
anthropic), for the natural language query layer over the property dataMCP, the Model Context Protocol, with FastMCP in Python, for tools Claude calls directly
Three custom MCP servers: HCAD property data, Open Food Facts product screening, UNFI wholesale cost
Data sources
Harris County Appraisal District bulk property data, about 7.4 million rows, free
Open Food Facts, the open packaged product database, free
UNFI Harmony Core wholesale API, built and gated on an account
NACS published industry benchmarks, for the simulation defaults
TxDOT traffic counts, for real road volume
Google Maps, for the locator
Data and backend
Supabase, which is hosted Postgres, for the property records and the signup capture
psycopg2, for the bulk load
rapidfuzz, for fuzzy matching on owner names that never spell the same way twice
pydantic, httpx, requests, python-dotenv
The simulation
Three.js r128, drawing 3-D in the browser
One single HTML file, no build step, no server, opens from disk
The website and the intel area
Next.js 16 with the App Router, React 19, TypeScript
Tailwind v4, for layout only, with the brand tokens as plain CSS variables
DM Serif Display and Hanken Grotesk, through Google Fonts
ESLint
Hosting and plumbing
Vercel, deploying on push from GitHub
Namecheap, for DNS
GitHub, private repos
Basic Auth in Next.js middleware, gating the intel area
Linear, tracking the build phases
Image and brand
Nano Banana, for the renders, the characters and the marketing aerials